


Currently, the S&P 500 trades at 21.44x vs. Wall Street’s 12-month earnings forecast.
This means that for every $100 invested in the S&P 500, investors would expect to see $4.66 in profits associated with their investments. This represents a 4.66% Earnings Yield. However, Earnings Yield is not the return the investor will realize.
While the companies in the S&P 500 are expected to earn that $4.66 per $100 invested, they will, for the most part, not return that capital to shareholders outright. Though some profits will be used for dividends or share buybacks, the majority of those profits will be held for future opportunities to reinvest in the business.
This will continue year after year until the investor eventually decides to sell their investment, at which point the return realized will be whatever the new market price of the S&P 500 is at that point in time. What will this return be? While the future is uncertain, there is much historical data to analyze the relationship between estimates of future earnings and subsequent 10-year returns.
Below is a scatterplot that has recently circulated the web, showing a clear relationship between the S&P 500 forward P/E ratio and subsequent 10-year returns:
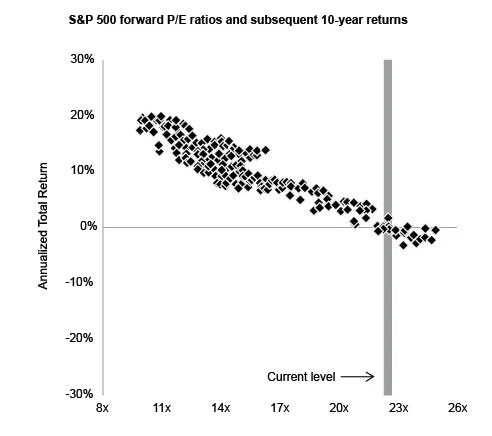
On the left side of the chart, we see that forward P/E multiples of ~10x correspond to a ~19% annualized total return for the next 10 years. This relationship continues fairly linearly down and to the right, reaching 0% annualized 10-year returns at multiples of ~21x and higher. The gray vertical bar illustrates where the S&P 500 trades today.
Put bluntly, this is depressing. Based on historical data, investors in the S&P 500 today cannot reasonably expect much more than 0% return on their investment for the next 10 years. This seems almost too extreme to believe, so we decided to run the numbers ourselves to see if we can replicate these findings.
What we found has profound implications for today’s investor, which we will discuss below.
This research note is part of Pine Creek Capital Management’s paid research library, but we are making it available for free to all readers. Free subscribers also get access to our weekly market updates, and occassional paid posts.
Part 1: Mapping the Relationship
The above chart has gone viral on social media and within investing circles, often without proper citation. While the results seem intuitive, i.e. higher valuations lead to lower long-term returns and vice versa, we at Pine Creek prefer to work from primary sources. If the source cannot be found, we find the data ourselves and create the primary source, allowing us to provide our readers and investors with proprietary insights and analysis not found elsewhere.
1.1 Trailing 12-Month P/E Multiples
First, we looked at historical trailing 12-month earnings data for the S&P 500 compared to future 10-year returns for the index. We started with trailing earnings as data is readily available spanning ~100 years, from 1926 to 2026. Below is that chart:
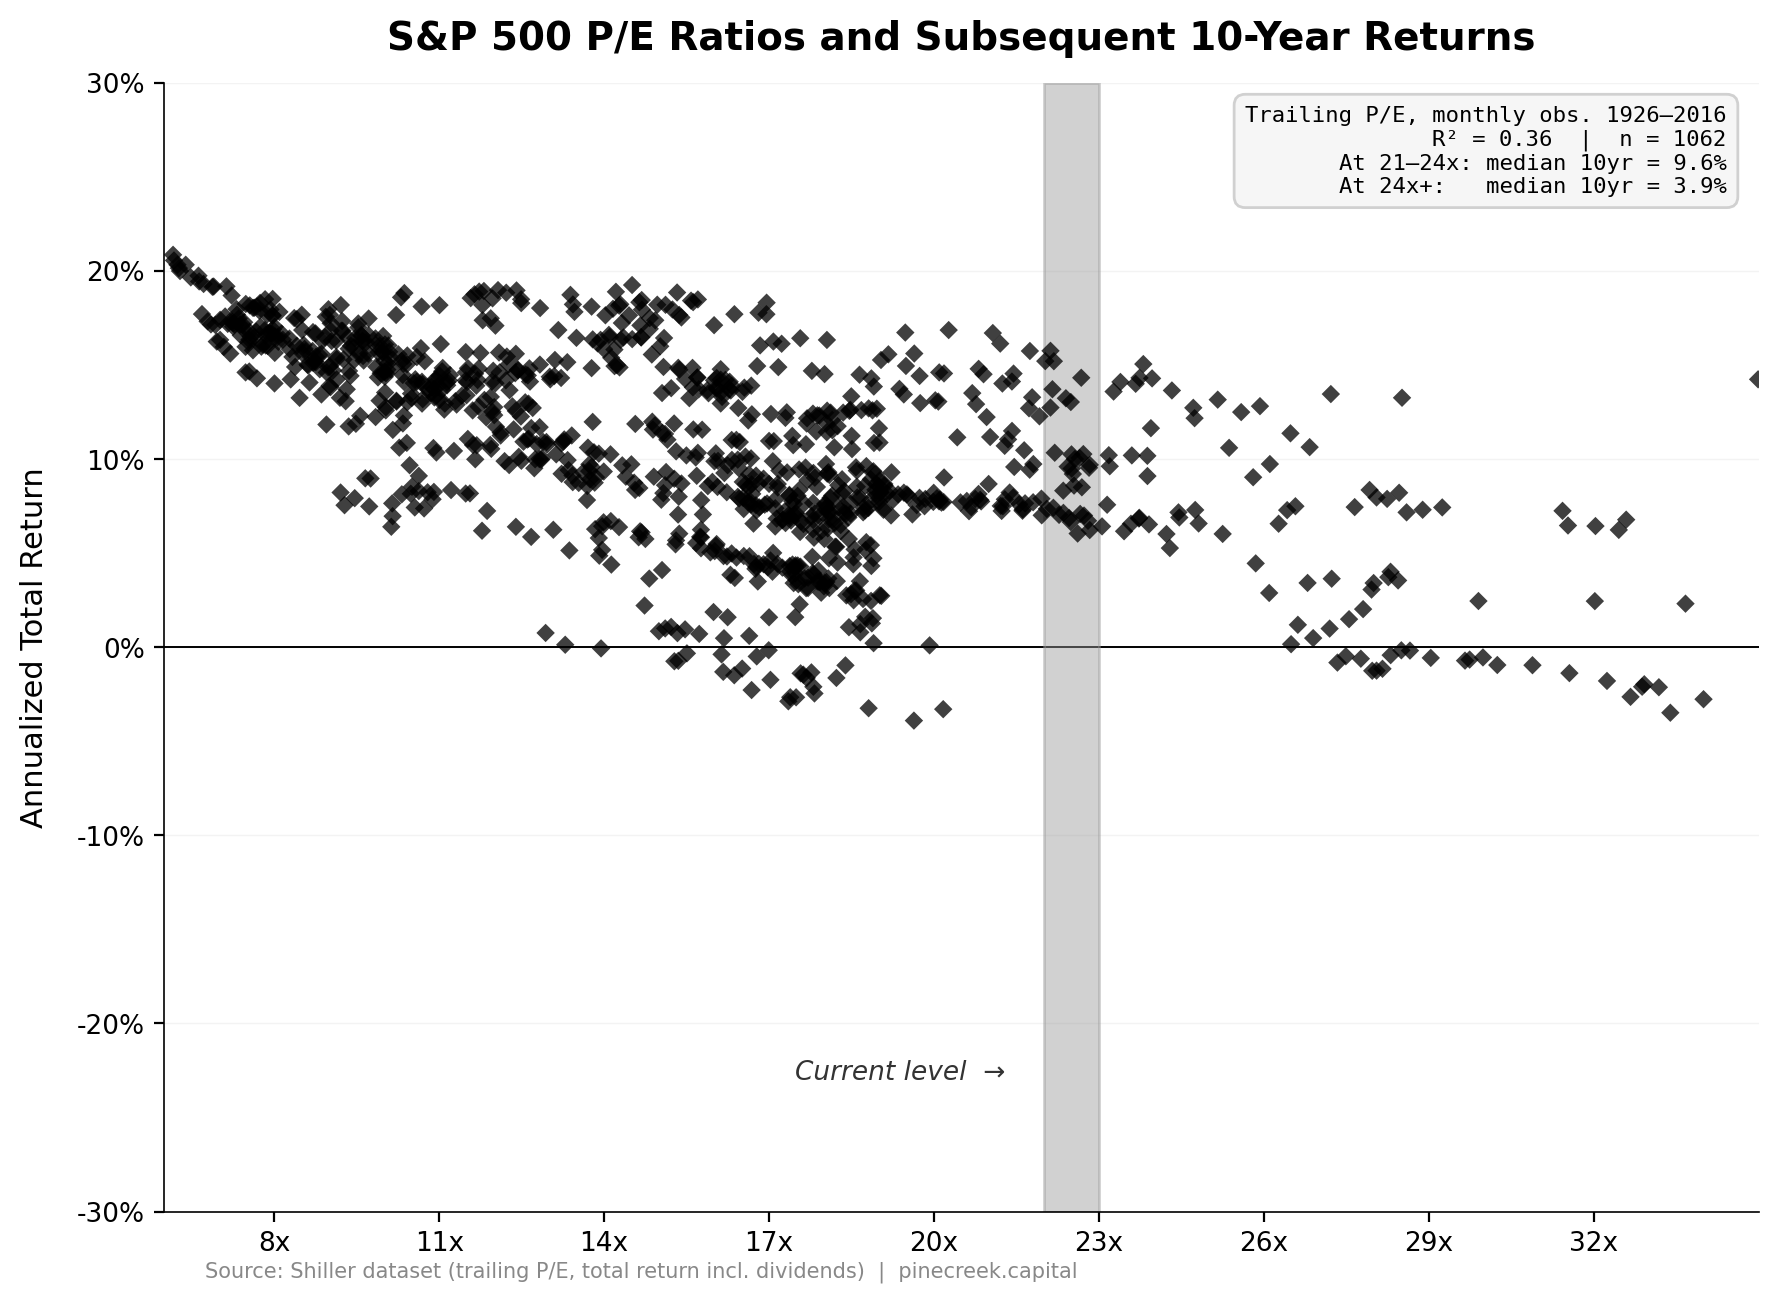
Here we see that the relationship is directionally similar but less strong. The linear relationship diverges, revealing low 10-year return outcomes between 10x and 20x P/E, with an interesting gap of 7%+ returns from 20x to 26x P/E, followed by low returns at 26x and up with a smattering of modestly high returns.
However, before we read into this chart too much, there is one key problem. This looks at the relationship between trailing 12-month earnings and future 10-year returns. This compares a backwards looking metric with a forward-looking one. Additionally, today’s investor is not investing on the basis of what companies earned just in the last year, but also how much they expect companies will earn over the next year (or longer!).
1.2 Forward 12-Month P/E Multiples
So let us put a pin in that chart and look now at forward 12-month earnings estimates:
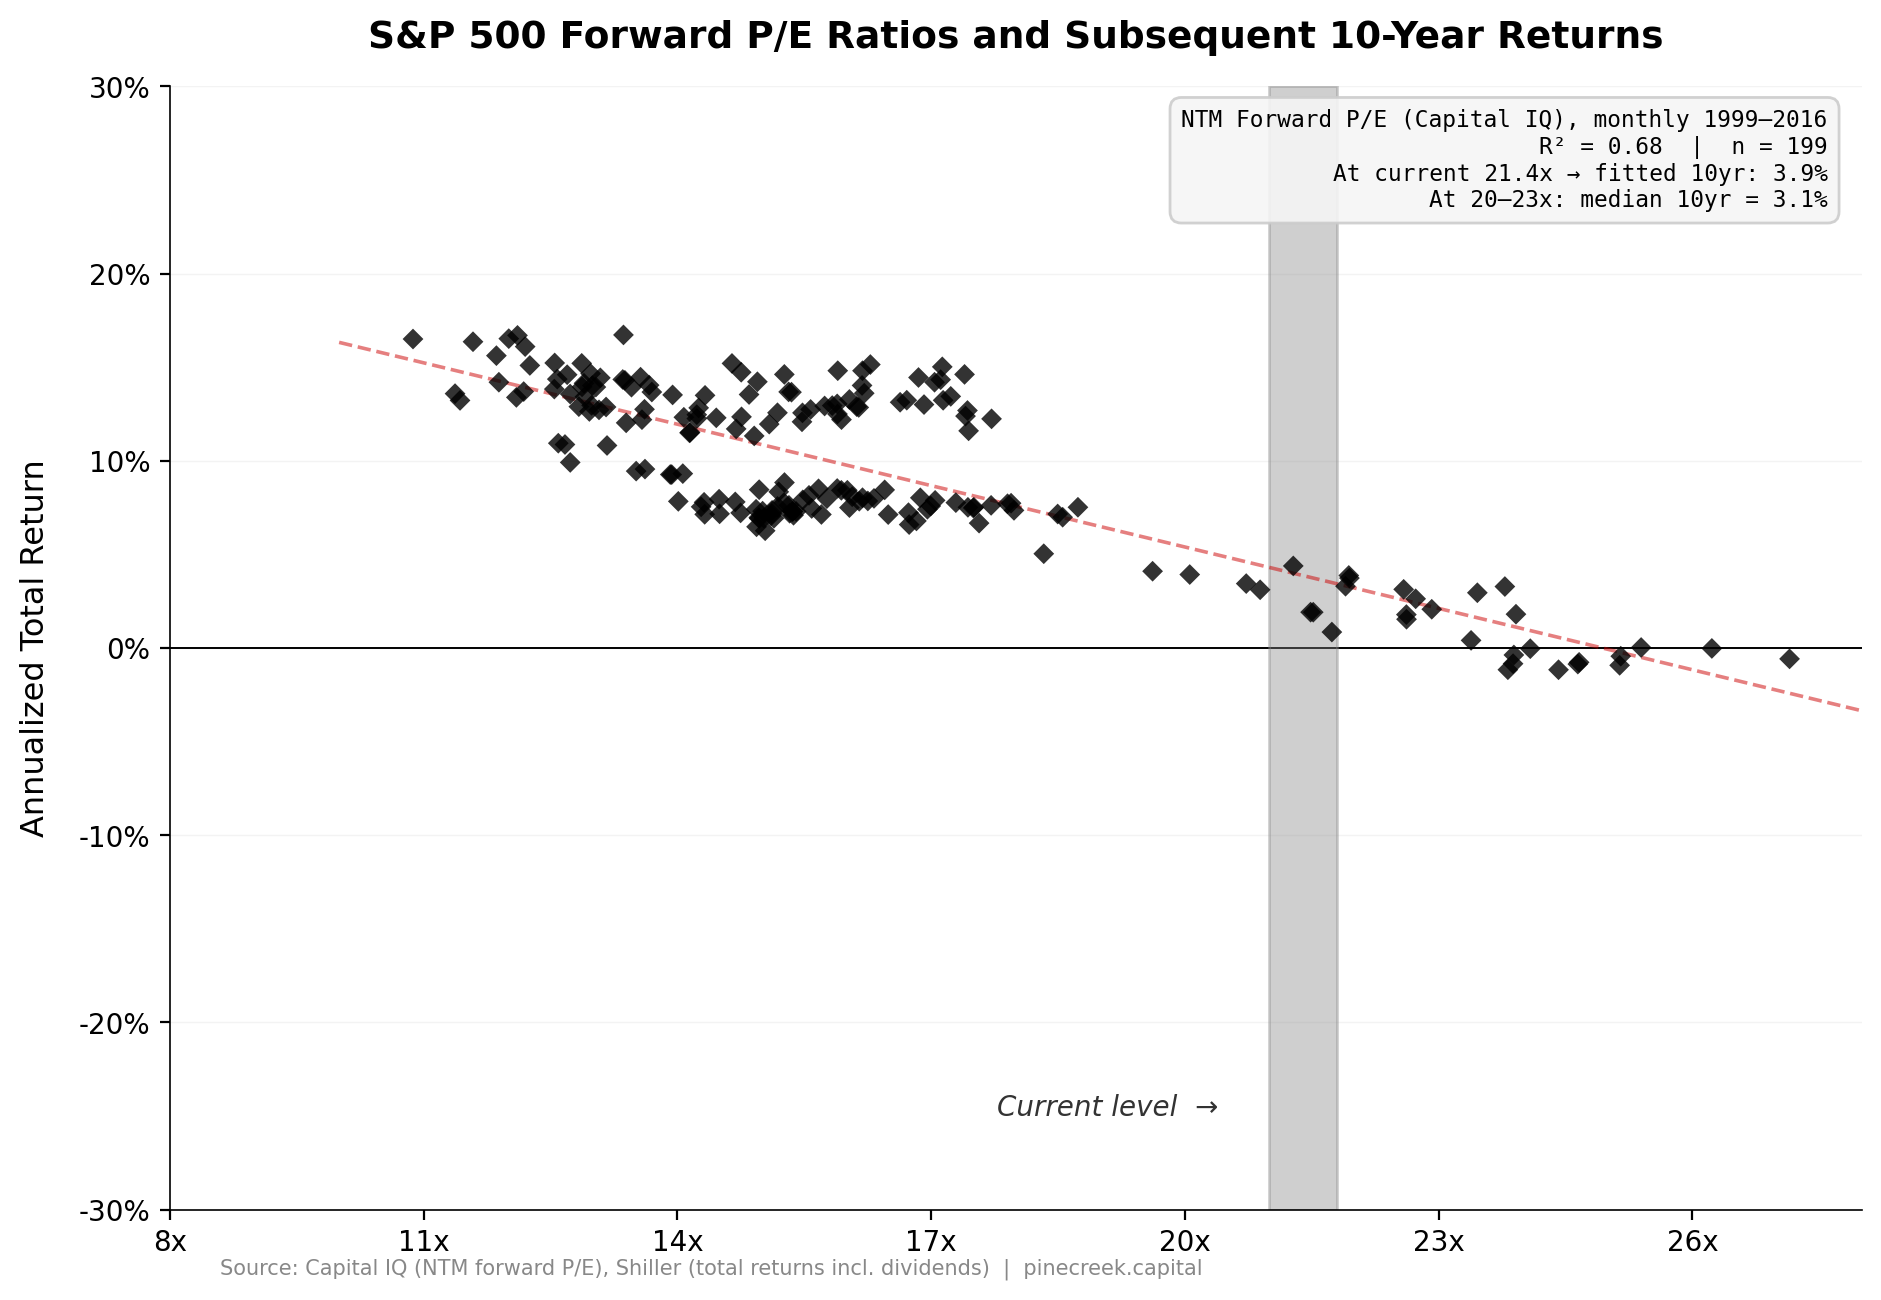
Here we see the relationship is much stronger, with one important caveat. Forward earnings estimates are notoriously difficult to source without a license to specific institutional databases, which Pine Creek does not yet have access to. Above is data sourced from Capital IQ, which goes back to 1999. While this is still nearly 200 observations on a monthly basis, we would prefer to have data going back much further. That will have to wait for another time.
Nevertheless, the relationship is clear: at forward P/E multiples of 18x and higher, investors in the S&P 500 have realized 10-year annualized returns of less than 5%. At today’s level of 21.44x forward earnings, investors can reasonably expect to earn between 0% and 5% per year, inclusive of dividends, for the next 10 years. The higher the valuation, the lower the return.
Part 2: Implications for Investors
We have now independently validated the finding that there is a linear negative relationship between the S&P 500’s price to forward 12-month earnings ratio (NTM P/E) and subsequent 10-year total return. At valuations of 18x and higher, expected annualized 10-year returns are between negative 2-3% and positive 5%. Today, the S&P 500 sits at 21.44x NTM P/E, implying an expected return of 3.9% per year for the next 10-years.
The next question becomes: how should investors position themselves in light of this?
2.1 Stock Allocations
Today’s investors are divided into two camps: bulls who enthusiastically point to prior performance as evidence that stocks “always go up,” sometimes advocating for a 100% stock portfolio, and skeptics who point to historically high equity valuations as reason to reduce exposure to stocks or even short equities outright.
However, our position sits somewhere in the middle. While it is true that there is a negative relationship between forward valuation and expected returns, it is important to note that the 10 year return is almost never negative.
Additionally, while the relationship is clear, it is still a historical relationship. There is no guarantee that this relationship must hold in the future. Yet the data strongly suggests this to be the case.
Therefore, we believe today’s investor should decrease exposure to US equities while still maintaining a modest exposure. The Pine Creek Capital Model Portfolio aims to hold between 60% and 70% total equity exposure.
2.2 Bond Allocations
In contrast to equities, today’s investors hold bonds in low regard. Currently, yields on 10-Year US Treasury Bonds are ~4.5%, much lower than the long-term annualized return on US Stocks of over 7%. However, this return is a 100 year average, which is decades longer than the average lifespan in the US, and double the typical investing horizon of 40 to 50 years. While it would be admirable, and in some views “optimal,” to hold a portfolio allocation for one’s entire life, it is virtually impossible in practice.
Additionally, the data available today gives every reason to believe that stock returns over the next 10 years will be approximately 3.9%. With that return comes all the volatility that comes with stocks. On the other hand, US Treasuries of a similar maturity offer a higher return of 4.5% that is all but guaranteed for today’s investor.
Therefore, we believe today’s investor should increase exposure to fixed income. The Pine Creek Capital Model Portfolio aims to hold between 30% and 40% total bond exposure.
2.3 Expectations of a 60/40 Portfolio
We have effectively argued that today’s investor should hold a 60/40 portfolio, to which many of today’s investors may find to be a letdown. After all, the 60/40 portfolio is dead. Stocks and bonds are too correlated, and bonds have underperformed in recent years. Yet our research shows a much different story, summarized by the chart below:
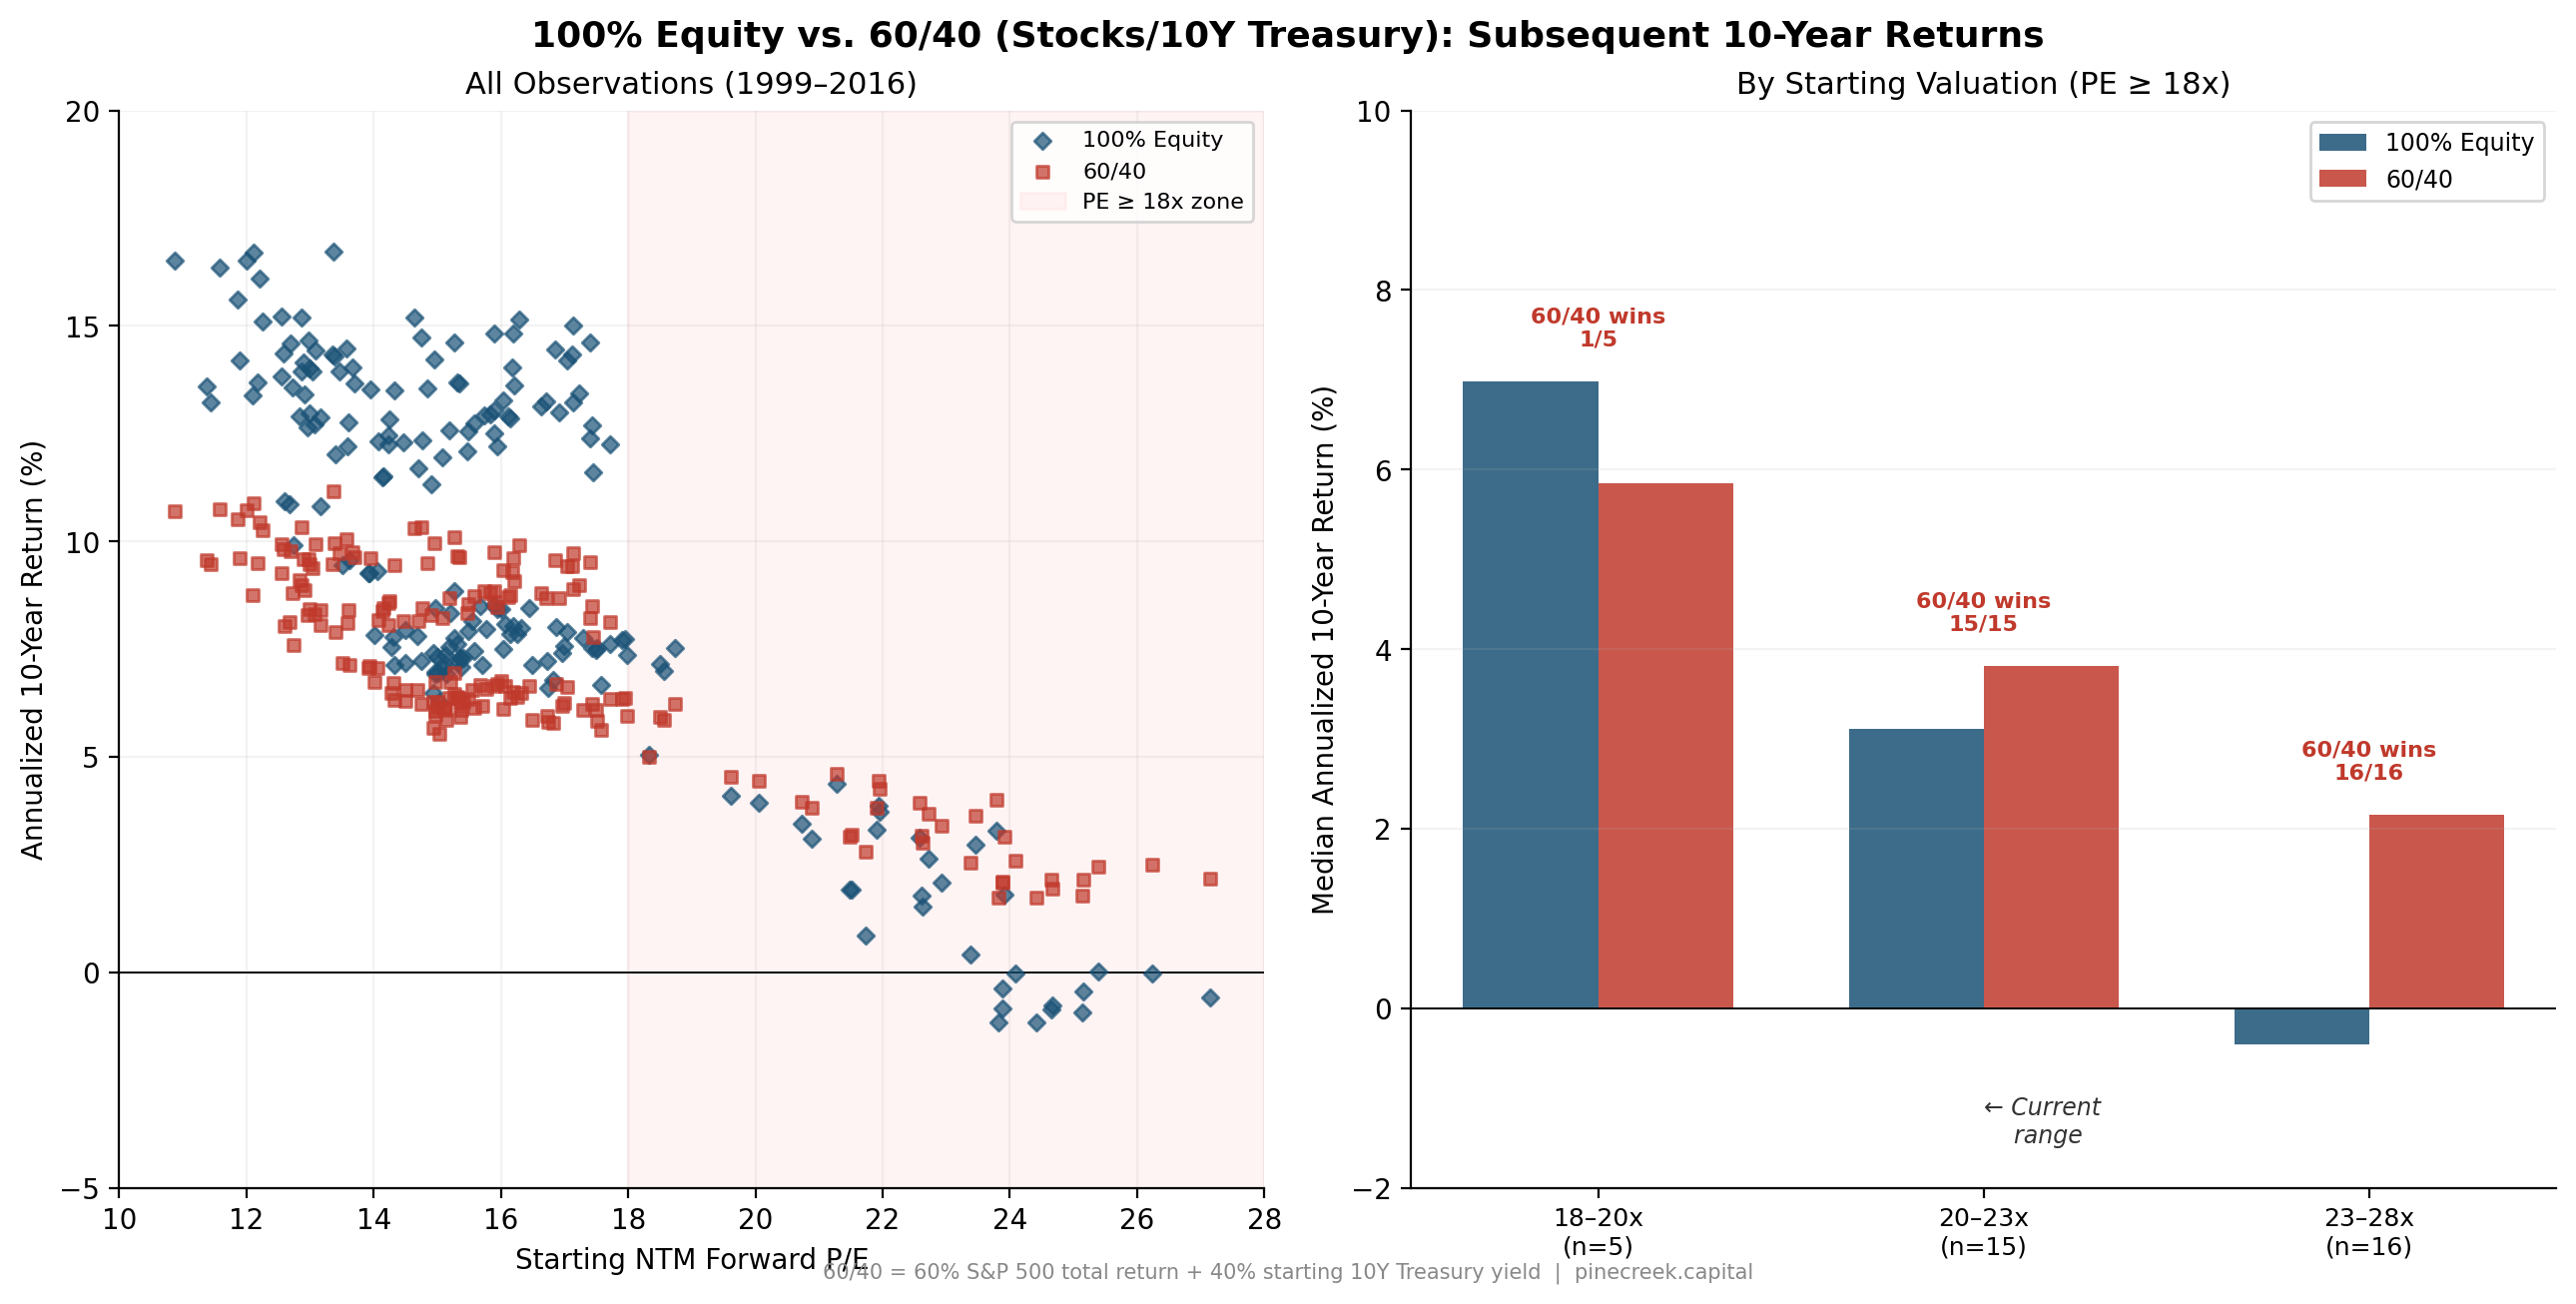
This chart answers a simple question: “How does a 60/40 portfolio compare to an all stock portfolio when the S&P 500 trades at 18x NTM P/E or higher?” In other words, sure the S&P 500 may have low future expected returns, but are bonds really the answer?
Yes, and we have divided the results into three categories: 18-20x, 20-23x, and 23-28x NTM P/E. There were five periods where the S&P 500 traded between 18-20x forward earnings. For the 10 years following these periods, an all-stock portfolio beat the 60/40 portfolio four out of five times.
Contrast this with the 31 periods in which the S&P 500 traded between 20-28x (combining the latter two categories). For the 10 years following these periods, investors in a 60/40 portfolio outperformed all stock portfolios 100% of the time. At 23-28x earnings, all stock portfolios had a negative median return, compared to the 60/40 portfolio at just above 2% per year.
Part 3: Conclusion
In this research note, we have reviewed the S&P 500’s current valuation and expected future returns over the next 10 years in the context of historical data going back to 1999. We have independently validated the finding that there is a negative linear relationship between NTM P/E of the S&P 500 and forward 10-year total returns. At today’s valuation of 21.44x, the expected 10-year return for the S&P 500 is 3.9%.
We then compared this return profile with 10-Year US Treasury Bonds which currently offer approximately 4.5%, advocating for a portfolio allocation between 60/40 and 70/30 stocks to bonds. This allocation is strongly supported by the available data, which shows that a 60/40 portfolio historically outperformed an all-stock portfolio for 100% of the 10 year periods following a valuation of 20x NTM P/E or more.
If you found this research valuable and would like to discuss its contents or investment implications further, you can reach us via email at brian@pinecreek.capital.
Disclaimer
This research note is published by Pine Creek Capital Management LLC for informational and educational purposes only. It does not constitute investment advice, a recommendation, or an offer to buy or sell any security. The analysis and opinions expressed herein are those of the author and are based on sources believed to be reliable, but accuracy and completeness are not guaranteed.
Past performance is not indicative of future results. All investing involves risk, including the possible loss of principal. The historical relationships described in this note may not persist in the future. Forward-looking statements are inherently uncertain and actual outcomes may differ materially from those implied by this analysis.
The “Pine Creek Capital Model Portfolio” referenced herein is a hypothetical allocation framework and does not represent an actual managed account or fund. Pine Creek Capital Management LLC is not a registered investment adviser. Readers should consult a qualified financial advisor before making investment decisions.
Data sources: S&P Capital IQ (forward earnings estimates), Robert Shiller / Yale (historical S&P 500 prices, dividends, and earnings), Federal Reserve H.15 (Treasury yields). Charts and analysis are original work by Pine Creek Capital Management.
Valuation is a poor timing tool.
It's a much better expectations tool.
High valuations don't tell you when markets will fall. They tell you what future returns are likely to look like if everything goes right.
The price you pay still matters. It just matters on a longer horizon than most investors are willing to wait.